Skip to content
A practical breakdown of where plush toy factories lose time and money — and the cutting, sewing, stuffing, quality control, and capacity planning adjustments that recover it — with reference benchmarks buyers and production managers can apply directly.
What Is Production Efficiency in Plush Toy Manufacturing?
Plush toy production efficiency describes how effectively a factory converts raw fabric, filling material, and labor hours into finished, sellable units without waste, rework, or idle capacity. It is measured across the entire plush toy production workflow — from fabric cutting and pattern nesting through sewing, stuffing, finishing, and quality control — rather than at any single station in isolation. A factory that sews quickly but wastes 18% of its fabric yardage, or one that cuts efficiently but bottlenecks at final inspection, is not actually efficient; it has simply relocated the loss.
Improving plush toy manufacturing efficiency matters for three interconnected reasons: it lowers unit cost without compromising the plush toy quality standards buyers expect, it shortens lead times during seasonal manufacturing peaks such as Christmas plush and back-to-school programs, and it reduces the defect rate that drives costly returns and re-inspection cycles.
Unlike rigid manufacturing processes such as injection molding, plush production is labor-intensive and highly dependent on operator skill, fabric behavior, and line balancing — which means efficiency gains come disproportionately from process design and workstation layout rather than from equipment alone.

Understanding the Plush Toy Production Workflow
Before optimizing any single stage, it helps to understand where time is actually consumed across a typical plush toy production line. Cutting, sewing, and stuffing dominate labor hours, while quality control and packing consume disproportionate calendar time relative to their labor content because of inspection queuing and rework loops.
Typical Time Allocation Across Plush Toy Production Stages
| Production Stage | Share of Total Labor Hours | Common Efficiency Loss Point |
|---|---|---|
| Fabric cutting & pattern layout | 12%–16% | Poor pattern nesting; fabric grain misalignment |
| Sewing & assembly | 45%–55% | Unbalanced line stations; thread and needle downtime |
| Stuffing & filling | 10%–14% | Inconsistent filling density; manual weight checks |
| Finishing (eyes, embroidery, closing seams) | 8%–12% | Hand-finishing bottlenecks; small-batch changeovers |
| Quality control & safety testing | 6%–9% | End-of-line-only inspection causing large rework batches |
| Packing & labeling | 5%–8% | Manual carton counting; late packaging material arrival |
This distribution makes clear why sewing line optimization delivers the largest single efficiency gain in most facilities, while cutting process efficiency and stuffing consistency are the two upstream levers that determine how smoothly the sewing line can run in the first place.
Cutting Process Efficiency: Where Waste Starts
Fabric is typically the single largest material cost in plush toy manufacturing, which makes cutting process efficiency a direct driver of gross margin, not just throughput. Inefficient pattern nesting — the arrangement of pattern pieces across a bolt of fabric — is the most common and most correctable source of waste. Manual layout by an experienced cutter can achieve reasonable utilization, but computerized nesting software consistently outperforms manual layout on fabrics with directional nap, such as short and long pile fabrics used for realistic animal plush.
Pattern Nesting and Fabric Utilization Benchmarks
Fabric Utilization Rates by Cutting Method
| Cutting Method | Typical Fabric Utilization | Best Suited For |
|---|---|---|
| Manual layout, single-ply cutting | 68%–74% | Small sample runs, one-off prototypes |
| Manual layout, multi-ply block cutting | 75%–80% | Mid-volume production of simple silhouettes |
| Computerized pattern nesting (CAD) | 85%–90% | Complex shapes, mixed sizes within one marker |
| Automated fabric spreading + die cutting | 88%–93% | High-volume repeat SKUs with stable patterns |
Tip: Batch Pattern Pieces by Fabric Direction. Group all pattern pieces that require the same nap direction into a single marker before cutting. Mixing directional and non-directional pieces on one layout forces conservative spacing that wastes 6%–10% more fabric than a marker organized by grain and pile direction.
Beyond nesting, cutting process efficiency also depends on blade maintenance and ply height control. Dull blades on multi-ply cutting increase fabric drag, causing pattern edges to shift mid-cut and produce out-of-tolerance pieces that either get scrapped or slow the sewing line with hand-trimming. Ply height should be matched to fabric loft: standard woven or knit shells tolerate higher ply stacks, while long-pile faux fur and sherpa require lower ply counts to maintain edge accuracy.
Sewing Line Optimization: The Core Efficiency Lever
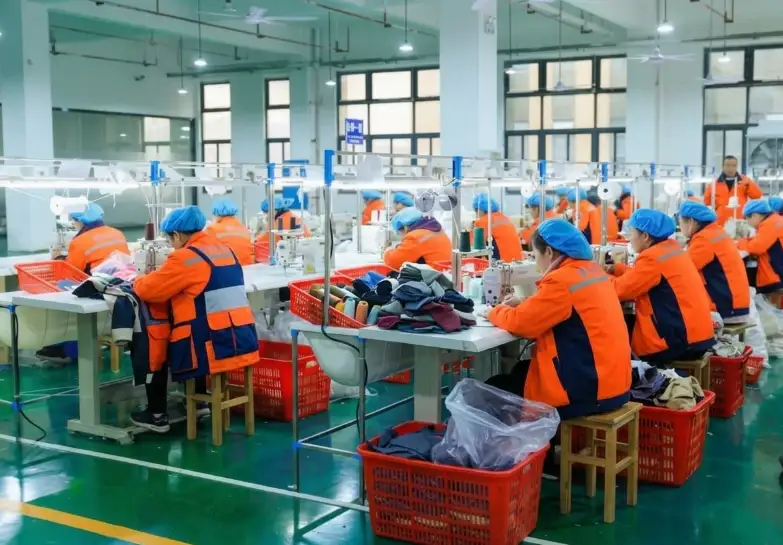
Because sewing and assembly consume roughly half of total labor hours, sewing line optimization produces the largest aggregate efficiency gain of any single intervention. The objective is line balancing — distributing operations across workstations so that no single station becomes a bottleneck that idles downstream stations while upstream stations pile up work-in-progress.
Line Balancing and Workstation Design
A well-balanced plush toy sewing line assigns operations by cycle time, not by headcount convenience. If closing a body seam takes twice as long as attaching an ear, the line either needs two operators on the body seam station or the operation needs to be split further. Facilities that skip formal line balancing typically see 15%–25% of total line capacity lost to idle time at underloaded stations while the bottleneck station determines the actual output rate for the entire line.
Sewing Line Efficiency Metrics by Balancing Approach
| Line Configuration | Typical Line Efficiency | Primary Constraint |
|---|---|---|
| Unbalanced line, informal station assignment | 55%–65% | Bottleneck station dictates output; frequent idle time |
| Balanced line, fixed cycle-time assignment | 75%–82% | Requires periodic rebalancing as SKU mix changes |
| Balanced line + cross-trained floaters | 85%–90% | Higher training investment needs skilled supervision |
| Modular cell production (small teams, multiple skills) | 80%–88% | Best for high SKU variety, lower per-cell volume |
Tip: Rebalance the Line Every Time the SKU Mix Changes. A line balanced for a simple round plush will be badly unbalanced once a complex mascot plush with embroidered facial features enters the mix. Rebalancing takes a supervisor 20–30 minutes per changeover but prevents days of accumulated inefficiency across a production run.
Facility layout also affects sewing line optimization independently of labor assignment. Straight-line layouts minimize material handling distance for simple products but create long feedback loops when a defect is caught downstream. U-shaped or cellular layouts shorten the distance between related operations and make it easier for a single operator to catch and correct minor issues before a piece moves three or four stations further down the line.
Stuffing and Filling Efficiency
Stuffing is a smaller share of total labor than sewing but has an outsized effect on both perceived quality and rework rates. Underfilled plush toys look collapsed on the shelf and fail visual QC; overfilled toys strain seams, increase material cost, and can push finished weight outside the tolerance buyers specify for a given plush toy size. Manual stuffing without a weight-check protocol is the most common source of density inconsistency.
Filling Density Reference Standards
Typical Filling Density by Plush Toy Category
| Plush Category | Fill Weight per Liter of Volume | Firmness Profile |
|---|---|---|
| Soft huggable plush (bedtime, comfort toys) | 28–35 g/L | Low firmness, high drape |
| Standard shelf plush (retail, gift) | 36–45 g/L | Medium firmness, holds shape on shelf |
| Firm-body mascot or display plush | 46–58 g/L | High firmness, structured silhouette |
| Weighted/travel pillow plush | Variable + weighted insert | Task-specific density by function |
Tip: Use Weight-Based Sampling, Not Visual Judgment, for Stuffing QC. Set a target weight range for each SKU and spot-check finished units on a calibrated scale every 30–50 pieces rather than relying on an operator’s visual assessment. Visual judgment alone allows density drift of 10%–15% across a shift as operator fatigue changes hand pressure and packing technique.
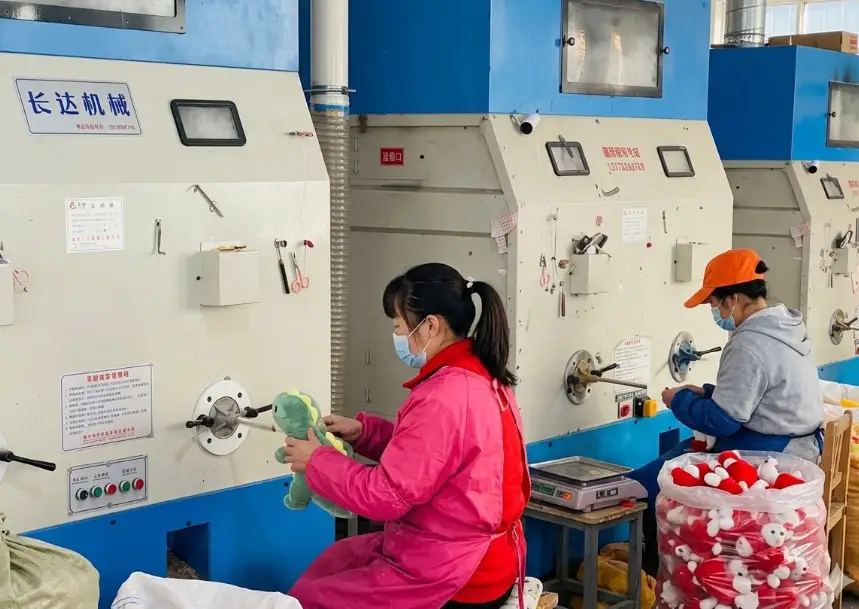
Mechanized stuffing machines improve consistency and throughput for simple, high-volume shapes but are less effective for plush toys with narrow limbs, ears, or other extremities that require hand-packing to avoid lumping. A hybrid approach — machine stuffing for the main body cavity followed by hand-finishing of extremities — is common in factories balancing plush toy production efficiency against shape complexity.
Quality Control Integration Without Slowing the Line
The instinct to concentrate quality control at the very end of the line feels efficient because it centralizes inspection resources, but it is one of the most common efficiency traps in plush toy manufacturing. End-of-line-only inspection means a defect introduced early in sewing is not caught until dozens or hundreds of units later, turning a small correction into a large rework batch.
In-Line vs. End-of-Line Quality Control
Quality Control Checkpoint Comparison
| QC Approach | Average Defect Detection Lag | Typical Rework Batch Size |
|---|---|---|
| End-of-line inspection only | 200–500 units | Large; often requires partial teardown |
| In-line checkpoints at 2–3 key stations | 15–40 units | Small; correctable within the same shift |
| In-line checkpoints + final random audit | 10–25 units | Minimal; near-zero large-batch rework |
Effective quality control integration places checkpoints immediately after the highest-risk operations — typically seam closure, eye or nose attachment (for choking hazard prevention on toys intended for young children), and stuffing density — rather than waiting until the finished plush reaches final packing. This does not require additional inspectors in most cases; it requires training sewing operators and line leads to perform a defined self-check and pass/fail handoff at their own station.
Tip: Pair Every Safety-Critical Attachment Point With an Immediate Pull Test. Eyes, noses, and any small attached components should be pull-tested at the workstation where they are attached, not batched for testing later. Catching a weak attachment within the same station takes seconds; catching it during final safety testing after hundreds of units have accumulated triggers a full batch recheck.
Material Flow and Inventory Management
Plush toy production efficiency is frequently constrained not by labor speed but by material flow — the timing and positioning of fabric, filling, trims, and accessories relative to where they are needed on the line. Work-in-progress bottlenecks form when downstream stations run out of a component (such as pre-cut ears or pre-embroidered face panels) while upstream stations continue producing components for a different SKU.
Reducing these bottlenecks generally comes down to sequencing cut components to match the sewing line’s actual consumption rate rather than cutting an entire SKU’s fabric requirement in one batch and pushing it downstream all at once. Factories that synchronize cutting output to sewing line takt time — the rate at which the line needs to consume the next component to hit its output target — see meaningfully less floor-space congestion and fewer partially assembled units sitting idle between stations.
Accessory design elements, such as bows, collars, or small attached props, deserve particular attention in material flow planning because they are frequently sourced from a different supplier or produced on a different sub-line than the main plush body. Misalignment between accessory delivery and main-body assembly is a recurring, avoidable cause of finishing-stage delay, especially during high-volume seasonal manufacturing pushes.
Automation and Technology in Plush Toy Production
Automation in plush toy manufacturing tends to deliver the strongest return on investment at the beginning and end of the production workflow — cutting and packing — rather than in the sewing operations themselves, which remain difficult to fully automate due to fabric flexibility and the fine motor precision required for curved seams.
Where Automation Delivers the Strongest Return
Automation ROI by Production Process
| Process | Automation Maturity | Typical Efficiency Gain |
|---|---|---|
| Fabric spreading & die cutting | High | 25%–35% faster cutting throughput |
| Pattern nesting (CAD/CAM software) | High | 10%–15% fabric savings |
| Sewing (curved seams, complex shapes) | Low–Medium | Limited; primarily operator-assist tools |
| Mechanized stuffing (simple shapes) | Medium–High | 30%–40% faster than full hand-stuffing |
| Metal detection & weight-check scanning | High | Near-100% inspection coverage vs. sampling |
| Carton packing & case labeling | Medium | 20%–30% faster packing cycle |
Tip: Automate Inspection Before Automating Assembly. Metal detection and automated weight-check scanning at the end of the line catch nearly all safety and density defects with minimal capital investment, while sewing automation for complex plush shapes carries a much longer payback period. Prioritizing inspection automation improves both plush toy production efficiency and consistency in safety testing without disrupting the sewing line.
Seasonal Capacity Planning and Efficiency
Seasonal manufacturing cycles — particularly Christmas plush, back-to-school, and promotional licensed runs — put plush toy production efficiency under the most pressure, because factories must absorb sharp volume swings without a proportional increase in permanent skilled labor. Efficient capacity planning during these periods relies on three levers: pre-training temporary or cross-shift labor on simplified station tasks well before peak demand hits, pre-cutting and staging high-runner SKU components during slower periods, and locking design changes early so the sewing line does not need mid-season rebalancing.

Factories that treat seasonal peaks as a scaled-up version of their standard line — rather than redesigning station assignments for the compressed timeline — routinely see efficiency drop by 20% or more during peak weeks, even though nominal headcount increases. Planning capacity around takt time and line balancing principles, rather than around raw labor hours added, preserves efficiency through demand swings.
Forecast accuracy plays a supporting but important role in this planning. Because filling material, trims, and packaging often carry longer lead times than fabric itself, a capacity plan built on a late or inaccurate seasonal forecast forces the line to either idle waiting on materials or rush unfinished components through quality control to hit a shipping date — both of which erode the efficiency gains built up during the rest of the year. Building a buffer of pre-approved, pre-cut components for the highest-confidence SKUs ahead of the confirmed order volume gives the line a head start once final quantities are locked in, without committing to full production before demand is certain.
Workforce Training and Skill Development
Plush toy production efficiency is ultimately dependent on operator skill in a way that few other manufacturing categories are, because sewing curved seams around limbs, ears, and facial features requires judgment and hand precision that cannot be fully standardized by machine settings. Factories that treat sewing operators as interchangeable at any station tend to see higher defect rates and slower cycle times than those that invest deliberately in skill development and cross-training.
Cross-Training and Skill Flexibility
Cross-training operators across two or three adjacent stations gives a supervisor the flexibility to shift labor toward whichever station is currently constraining the line, without waiting for a new hire to ramp up. This flexibility matters most during SKU transitions and seasonal ramp-ups, when the bottleneck station on the line can shift multiple times within a single week as the product mix changes. A common and effective structure is to train every operator on their primary station plus one upstream and one downstream station, so that short-term rebalancing does not require pulling in an operator who has never performed the task.
Skill development also directly affects first-pass yield. New operators typically produce a higher defect rate for the first two to four weeks on a new operation, which is why staged onboarding — starting a new hire on lower-complexity components such as straight seams before moving to curved facial panels or narrow limb attachments — reduces early-stage rework compared with placing new operators directly on the most demanding stations. Pairing new operators with an experienced line lead for the first several shifts on any new station further shortens this ramp-up period.
A practical way to operationalize this flexibility is to maintain a simple skills matrix mapping each operator to the stations they are qualified to run, along with their current proficiency level, and to review it on a quarterly basis. Keeping this matrix current makes rebalancing decisions faster during SKU changes and highlights which stations are under-resourced in cross-trained backup coverage before that gap causes a production delay.
Incentive structures also influence sustained efficiency. Piece-rate compensation tied purely to output volume can inadvertently encourage operators to rush safety-critical steps such as pull-testing attached eyes or noses, undermining the quality control integration described earlier. Factories that combine a baseline output target with a quality bonus tied to first-pass yield tend to sustain both throughput and defect rate improvements more reliably than those using output-only incentives, because the compensation structure reinforces rather than competes with the quality checkpoints built into the line.
Measuring and Sustaining Efficiency Gains
Improvements to cutting process efficiency, sewing line optimization, stuffing density control, and quality control integration only compound if they are measured consistently over time. The most useful production efficiency indicators for plush toy manufacturing are units per labor hour by station, fabric utilization percentage by marker, first-pass yield at each QC checkpoint, and rework rate as a percentage of total output. Tracking these four metrics weekly, rather than only at month-end, allows a supervisor to catch a line imbalance or a fabric utilization drop within days rather than discovering it after an entire production run has already absorbed the loss.
Sustained plush toy production efficiency is rarely the result of a single large intervention. It is built from the cumulative effect of tighter pattern nesting, a properly balanced sewing line, consistent stuffing density, in-line quality checkpoints, synchronized material flow, and targeted automation at the highest-return points in the workflow — reinforced by seasonal capacity planning that protects the line from the disruption of demand spikes.
Frequently Asked Questions
1. What is the single biggest driver of plush toy production efficiency?
Sewing line optimization typically has the largest single impact because sewing and assembly account for 45%–55% of total labor hours in most plush toy factories. Balancing the line by actual cycle time per operation, rather than by informal station assignment, commonly recovers 15%–25% of lost capacity without any capital investment. That said, sewing line gains are limited if upstream cutting waste or downstream QC bottlenecks are left unaddressed, so the most durable efficiency improvements treat the whole workflow together rather than optimizing one station in isolation.
2. How much fabric waste is normal in plush toy cutting, and how can it be reduced?
Manual single-ply cutting typically yields 68%–74% fabric utilization, meaning roughly a quarter to a third of yardage becomes offcuts and scrap. Computerized pattern nesting raises utilization to 85%–90% by packing pattern pieces more tightly, particularly on complex or mixed-size markers. The most effective reduction step is grouping pattern pieces by fabric nap direction before layout, since mixed-direction markers force conservative spacing that alone can waste an additional 6%–10% of fabric.
3. Why does stuffing density inconsistency happen, and how is it prevented?
Stuffing density inconsistency usually comes from relying on an operator’s visual judgment rather than a measured target, which allows density to drift 10%–15% across a shift as hand pressure and packing technique change with fatigue. Prevention involves setting a defined fill-weight range per SKU (commonly 28–58 grams per liter of volume depending on the plush category) and spot-checking finished units on a calibrated scale at a fixed interval, such as every 30–50 pieces, rather than trusting visual inspection alone.
4. Should quality control happen only at the end of the line, or throughout production?
Quality control integrated throughout the line, at 2–3 key checkpoints such as seam closure and safety-critical attachment points, catches defects within 15–40 units of occurrence, compared with 200–500 units when inspection happens only at the end of the line. Concentrating all QC at the final stage feels efficient because it centralizes inspectors, but it turns small, easily corrected issues into large rework batches that can require partial teardown of finished goods.
5. Which parts of plush toy production benefit most from automation?
Fabric spreading, die cutting, and pattern nesting software show the highest automation maturity and deliver 25%–35% faster cutting throughput along with 10%–15% fabric savings. Automated metal detection and weight-check scanning also deliver strong returns by providing near-complete inspection coverage instead of statistical sampling. Sewing automation for complex, curved plush shapes remains limited in maturity, since fine motor precision on flexible fabric is difficult to replicate mechanically, so most gains there still come from operator-assist tools and line balancing rather than full automation.
6. How does material flow affect overall plush toy production efficiency?
Even a well-balanced sewing line loses efficiency if components arrive out of sync with the line’s actual consumption rate. Work-in-progress bottlenecks form when cutting produces an entire SKU’s components in one large batch instead of sequencing output to match the sewing line’s takt time, leading to floor congestion and idle partially assembled units. Synchronizing component delivery — including accessories like bows or collars that are often produced on a separate sub-line — with main-body assembly timing reduces finishing-stage delays significantly.
7. How should factories plan capacity for seasonal peaks like Christmas plush without losing efficiency?
Factories that simply add headcount to their standard line configuration during peak seasons routinely see efficiency drop by 20% or more because the added labor is not matched to a rebalanced line. Effective seasonal capacity planning pre-trains temporary or cross-shift labor on simplified tasks before demand peaks, pre-cuts and stages components for high-runner SKUs during slower periods, and avoids mid-season design changes that would require rebalancing the sewing line under time pressure.
8. What metrics should a factory track to sustain efficiency improvements over time?
Four indicators give the clearest ongoing picture of plush toy production efficiency: units produced per labor hour by station, fabric utilization percentage by cutting marker, first-pass yield at each quality control checkpoint, and rework rate as a percentage of total output. Reviewing these weekly rather than only at month-end allows supervisors to catch a line imbalance, a drop in fabric utilization, or a rising rework rate within days, before the loss compounds across an entire production run.