How to Reduce Plush Toy Manufacturing Costs is a key concern for toy brands, retailers, and startups looking to stay competitive in today’s market. By optimizing material sourcing, improving production efficiency, reducing waste, and selecting the right manufacturing partner, businesses can significantly lower costs while maintaining the quality and safety standards customers expect.
Reducing plush toy manufacturing costs is not the same as finding the lowest unit price. Buyers who focus only on the quoted unit price frequently end up paying more in total — through excess sampling rounds, quality failures, rework, compliance testing surprises, and inefficient order structures — than buyers who approach cost reduction as a systematic, multi-variable exercise. The distinction between the two approaches determines whether cost reduction is durable and compounding or illusory and short-lived.
This guide examines every major cost driver in plush toy manufacturing — materials, design complexity, tooling, sampling, order volume, compliance, packaging, and supplier relationship structure — and explains, in each case, where meaningful cost reduction is available and how to capture it without undermining product quality or market compliance. The framework applies whether you are sourcing your first custom plush order or optimizing a production program that spans multiple SKUs and several thousand units per run.
Why Plush Toy Manufacturing Costs Are More Controllable Than Most Buyers Realize
Most buyers approach the cost of a custom plush toy as something that is largely determined by the supplier — a number that arrives in a quotation and can be nudged marginally through negotiation. This understanding is incomplete in a way that consistently costs buyers money. The reality is that a significant proportion of plush toy manufacturing cost is determined not by the supplier but by the decisions the buyer makes before the order is placed: the complexity of the design, the material specifications selected, the order volume committed, the number of colorways requested, the packaging format chosen, and the efficiency with which the sampling process is managed.
Understanding which cost drivers are under buyer control — and which are genuinely determined by the factory — is the first step in building a cost reduction approach that is grounded in how plush toy manufacturing actually works rather than how buyers often assume it works.
Plush Toy Cost Drivers: Buyer-Controlled vs. Factory-Determined
| Cost Component | Typical % of Total Cost | Primary Control | Cost Reduction Lever |
|---|---|---|---|
| Outer fabric (type, GSM, pile) | 30–45% | Buyer specification | Fabric grade and certification selection |
| PP cotton/filling material | 8–15% | Buyer specification | Density specification and filling type |
| Labor (cutting, sewing, assembly) | 20–30% | Factory + design complexity | Design simplification reduces labor hours |
| Accessories (eyes, noses, trims) | 5–10% | Buyer specification | Standardizing to stock components |
| Embroidery and printing | 3–8% | Buyer specification | Reducing stitch count and panel count |
| Packaging | 5–12% | Buyer specification | Format simplification and volume bundling |
| Sampling and development | Fixed project cost | Buyer process efficiency | Brief quality, revision round reduction |
| Compliance and testing | Fixed project cost | Buyer market choice | Bundling tests, pre-certified materials |
| Factory overhead and margin | 10–18% | Factory | Volume, relationship, payment terms |
The table above makes one thing structurally clear: the majority of plush toy production cost sits in components that buyers directly control through their design specifications, material choices, and order parameters. Factory overhead and margin — the component that most buyers assume is the primary negotiation target — typically represents only 10 to 18 percent of total cost. Negotiating the factory’s margin is a far less productive cost reduction strategy than optimizing the specifications that drive the other 82 to 90 percent.
How Does Design Complexity Drive Manufacturing Cost — and Where Can It Be Simplified Without Sacrificing Quality?
Design complexity is the single largest controllable cost driver in custom plush toy manufacturing. It affects labor cost, material waste, sampling difficulty, revision round frequency, and quality failure risk simultaneously. A design that looks only marginally more complex than a simpler alternative may be significantly more expensive to manufacture because of the non-linear relationship between design complexity and production labor.
The relationship between design complexity and manufacturing cost operates through several specific mechanisms. Each additional fabric panel requires pattern development, cutting, alignment, and sewing — all of which add labor time. Each additional color in the fabric layout requires separate fabric procurement and potentially separate fabric roll management on the production line. Each accessory — safety eyes, plastic noses, metal zippers, woven labels at unusual positions — requires individual attachment, positioning verification, and quality checking. Complex three-dimensional shaping requires more precise stuffing control and typically more finishing time.
Design Complexity Cost Impact Reference
| Design Element | Low Complexity Version | High Complexity Version | Typical Cost Uplift | Quality Trade-off if Simplified |
|---|---|---|---|---|
| Body panel count | 4–6 panels | 12–18 panels | +15–35% labor | Minimal — shape detail adjustable |
| Facial feature method | Embroidery (2–3 colors) | Multi-layer appliqué + embroidery | +20–40% on facial labor | Low — embroidery can achieve high character fidelity |
| Fabric colorway count | 2 fabrics per SKU | 6+ fabrics per SKU | +$0.40–$1.20 per unit | None — colorway count is aesthetic, not quality |
| Accessories | Safety eyes only | Safety eyes + nose + magnetic closure + ribbon | +$0.50–$1.80 per unit | Low — evaluate which accessories drive perception |
| Filling type | Standard PP cotton | Mixed PP + glass bead base | +$0.80–$2.50 per unit | Moderate — weighted feel changes product category |
| Packaging | Polybag + printed sticker | Custom rigid box + insert + tissue | +$1.20–$4.00 per unit | Low for most markets — packaging is rarely quality |
Tip — Simplify Before You Brief, Not After You Sample
The most expensive place to simplify a design is after a sample has already been produced. Every design change that occurs after sampling adds a revision round — with sampling fees, revision shipping costs, and timeline delay. Buyers who conduct a design rationalization review before submitting the production brief — specifically evaluating which design elements are essential to the product’s character and which are incremental — recover cost before it is incurred rather than chasing it after the fact. A five-minute review of panel count, accessory list, and packaging format before briefing can eliminate one or two revision rounds that would each cost $150 to $300 plus shipping.
The Panel Reduction Approach — Where the Largest Labor Savings Live
Panel reduction is the most direct route to labor cost savings in plush toy manufacturing. Each panel eliminated from a design removes the labor associated with cutting that panel, aligning it for sewing, sewing its seams, and managing its positioning during assembly. For designs that currently use 12 or more panels, a review of which panels contribute to distinctive shape versus which replicate adjacent geometry can frequently identify 3 to 5 panels whose elimination does not visually or functionally alter the product but reduces labor cost by 15 to 25 percent.
The most productive approach to panel reduction is to request that your factory’s pattern-making team review the existing design for panel consolidation opportunities — many experienced factories can identify consolidation options that produce the same or very similar visual result at materially lower panel counts. This collaborative approach captures cost savings without requiring design changes that the buyer may not be positioned to evaluate independently.
Facial Embroidery vs. Multi-Component Faces — A Cost Comparison That Surprises Many Buyers
Many custom plush designs incorporate multi-component facial construction — safety eyes, plastic noses, appliquéd cheeks, and embroidered details. Each component adds unit cost, adds a quality control checkpoint, and adds a potential failure point for safety compliance. High-quality embroidery-only facial construction — using dense, multi-color embroidery to create dimensional-looking eyes, noses, and expressions — can achieve remarkable character fidelity at lower unit cost and with a simpler compliance profile. For buyers whose designs use four or more facial components, a comparison sample using embroidery-only construction is worth commissioning before finalizing the production approach.

How Does Material Selection Affect Plush Toy Manufacturing Cost — and How Can Buyers Optimize Without Downgrading?
Material cost typically represents 40 to 60 percent of the total unit cost of a plush toy — making it the single largest cost component and the highest-leverage area for cost optimization. The challenge is that material cost optimization and material quality downgrade are easily confused — and conflating the two is a common and costly buyer mistake.
Genuine material cost optimization identifies opportunities to achieve the same quality outcome at lower material cost: selecting a fabric with equivalent softness, appearance, and compliance characteristics at a more efficient GSM weight; using a stock fabric from the factory’s existing supplier relationships rather than specifying a custom dye lot; choosing filling density that meets the product’s firmness specification without over-filling. Material quality downgrade, by contrast, substitutes a lower-quality material that changes the product’s feel, appearance, durability, or compliance status — and generates commercial risk that typically far exceeds any unit cost saving.
Material Selection Cost Optimization Framework
| Material | Cost-Increasing Specification | Cost-Optimized Alternative | Cost Saving Estimate | Quality Impact |
|---|---|---|---|---|
| Outer fabric | Custom dye lot, non-stock color | Factory stock color from existing inventory | $0.20–$0.60/unit + sampling cost | None — stock colors maintained to quality standard |
| Outer fabric | High-pile 15mm+ sherpa | 9–12mm standard plush (target market appropriate) | $0.30–$0.80/unit | Low if pile height is not core to product identity |
| PP cotton filling | Over-specified density (e.g. 1,800g per unit) | Right-specified density per shape + firmness target | $0.15–$0.50/unit | None — correct specification, not downgrade |
| Safety eyes | Custom-sized eyes in non-stock dimension | Stock safety eye sizes (6mm, 9mm, 12mm, 18mm) | $0.08–$0.25/unit + tooling cost | None — stock sizes cover most design requirements |
| Labels | Woven label with custom loom pattern | High-quality printed label in same position | $0.06–$0.18/unit | Low — printed labels achieve high quality at lower cost |
| Packaging | Custom rigid box with full-bleed print | Kraft box with printed insert card | $1.00–$3.50/unit | None for functional markets; moderate for premium gifting |
The Fabric GSM Optimization Principle
Fabric GSM (grams per square meter) is the primary determinant of material cost for plush outer fabric. Higher GSM fabrics are heavier, denser, and generally more expensive — but they are not always better for the buyer’s specific product. A plush toy that will be sold as a budget-friendly children’s product may not benefit from the same GSM specification as one positioned as a premium collectible. The correct GSM specification is the one that achieves the target softness, pile height, and durability for the product’s intended market — not the highest available.
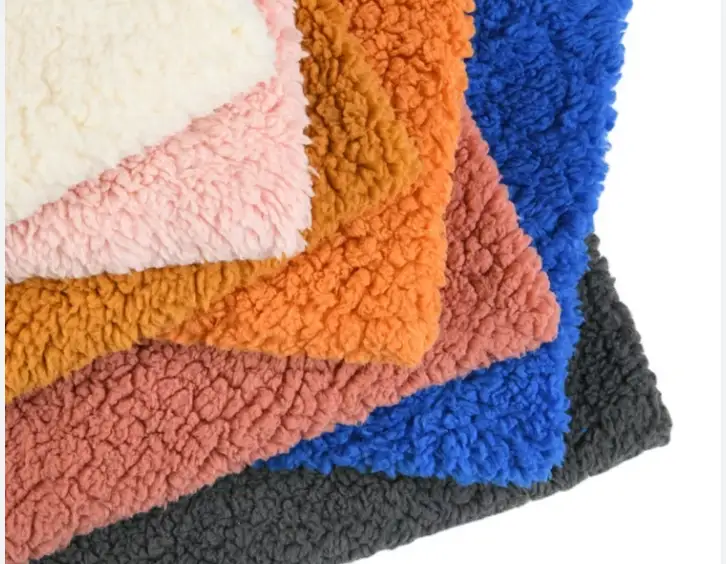
Buyers who specify fabric by appearance and feel target rather than by exact GSM number give their manufacturing partner more flexibility to achieve the visual and tactile result at the most cost-efficient weight. This approach — specifying what the fabric should feel like rather than exactly what it should weigh — frequently produces the same quality outcome at 10 to 20 percent lower fabric cost.
Using Factory Stock Materials — The Most Underutilized Cost Lever
Most experienced plush toy factories maintain established relationships with material suppliers and carry inventory of standard fabrics, fillings, safety accessories, and embroidery threads. Products designed around these stock materials avoid the minimum order quantities, extended lead times, and price premiums associated with custom or non-standard material specifications. For buyers whose product concept allows color and texture flexibility, designing around the factory’s stock material offering — reviewing available fabrics during the briefing stage rather than specifying colors and textures from scratch — can reduce material cost by 15 to 30 percent while simultaneously reducing sampling rounds and lead time.
How Does Order Volume Affect Unit Cost — and What MOQ Strategies Reduce Cost Without Overcommitting?
Volume is the most structurally powerful cost driver in plush toy manufacturing. The relationship between order volume and unit cost is driven by fixed cost amortization: sampling fees, tooling costs, production setup, machine calibration, and QC documentation are incurred once per production run regardless of quantity. Spreading those fixed costs across more units reduces the per-unit contribution of each fixed cost element — producing the volume-price relationship that appears in every supplier’s price tier table.
Understanding this mechanism — rather than treating the volume discount as an arbitrary commercial concession — makes it possible to use volume strategy much more precisely. The question is not simply “can we order more?” but “where is the fixed cost amortization curve steep enough that incremental volume produces meaningful unit cost reduction?”
Volume Tier Cost Structure Example (Illustrative)
| Order Quantity | Typical Unit Price Range | Fixed Cost per Unit | Variable Cost per Unit | Effective Unit Cost (incl. fixed) |
|---|---|---|---|---|
| 300 units (min) | $7.50–$9.00 | $2.20 | $5.80 | $8.00 |
| 500 units | $6.50–$7.80 | $1.30 | $5.80 | $7.10 |
| 1,000 units | $5.50–$6.60 | $0.65 | $5.80 | $6.45 |
| 2,000 units | $4.90–$5.80 | $0.33 | $5.80 | $6.13 |
| 5,000 units | $4.20–$5.10 | $0.13 | $5.80 | $5.93 |
| 10,000+ units | $3.80–$4.60 | $0.07 | $5.80 | $5.87 |
The table above illustrates a key insight: the unit cost reduction from increasing volume is steepest at lower volumes and flattens significantly above 2,000 to 3,000 units. The jump from 300 to 1,000 units produces a much larger unit cost reduction than the jump from 5,000 to 10,000 units. For buyers currently ordering at minimum quantities, reaching the 1,000-unit threshold — even by combining colorways or variant designs under a single production run — often produces the most significant achievable unit cost reduction available.
Multi-SKU Consolidation — Reaching Volume Thresholds Without Over-Stocking Any Single Design
Buyers who manage multiple plush toy SKUs have access to a cost reduction strategy that single-product buyers do not: production consolidation. When multiple SKUs share the same base body construction and differ only in colorway, fabric color, or accessory variation, they can frequently be batched into a single production run — with the total volume counting toward the pricing tier and the per-SKU minimum being much lower than would be achievable individually.
A buyer ordering three colorway variants of the same base design at 400 units each is effectively ordering 1,200 units of a single production setup. If the factory supports this consolidated pricing structure — which most do when the production setups genuinely overlap — the effective unit price approaches the 1,000-unit tier rather than the 400-unit tier, representing a meaningful cost reduction across all three colorways simultaneously.
Tip — Combine Colorways Into One Production Run to Hit Better Price Tiers
When your range includes two or more colorway variants of the same base design, ask your supplier explicitly whether they can process them as a single production run for pricing purposes. Many experienced factories will apply consolidated volume pricing when the patterns, construction, and materials are shared — meaning three 400-unit colorway orders may qualify for 1,200-unit pricing. The setup cost is incurred once, and the per-unit overhead is amortized across the full combined quantity. This single conversation can reduce unit cost by 12 to 22 percent without changing the design, material, or order commitment for any individual SKU.
How Does the Sampling Process Contribute to Total Manufacturing Cost — and How Can Buyers Reduce Sampling Expenditure?
Sampling cost is one of the most consistently underestimated components of the total cost of a new plush toy product launch. Buyers who focus on unit price frequently treat sampling as a minor administrative expense — a few hundred dollars per design — and are then surprised to find that their actual sampling expenditure, across multiple revision rounds and international shipping costs, has added $800 to $2,500 or more to the project before a single production unit is ordered.
The core mechanism that drives sampling cost is revision rounds. Each revision round — driven by a design change, a material substitution, a color correction, or a construction modification — requires a new physical sample, which incurs a sampling fee and an international shipping cost for both the outbound sample and the review process. For buyers who routinely require three, four, or five revision rounds on new designs, sampling cost is a material budget item whose reduction represents real commercial value.
Sampling Cost Accumulation by Revision Round Scenario
| Scenario | Revision Rounds | Sample Fee per Round | Shipping per Round | Total Sampling Cost | Days Lost |
|---|---|---|---|---|---|
| Optimized (well-briefed) | 1 | $200 | $60 | $260 | 7–10 |
| Typical (average brief quality) | 2–3 | $180 | $60 | $600–$720 | 21–35 |
| Inefficient (incomplete brief) | 4–5 | $160 | $60 | $880–$1,100 | 42–60 |
| Redesign mid-sampling | 6+ | $150 | $60 | $1,260+ | 70+ |
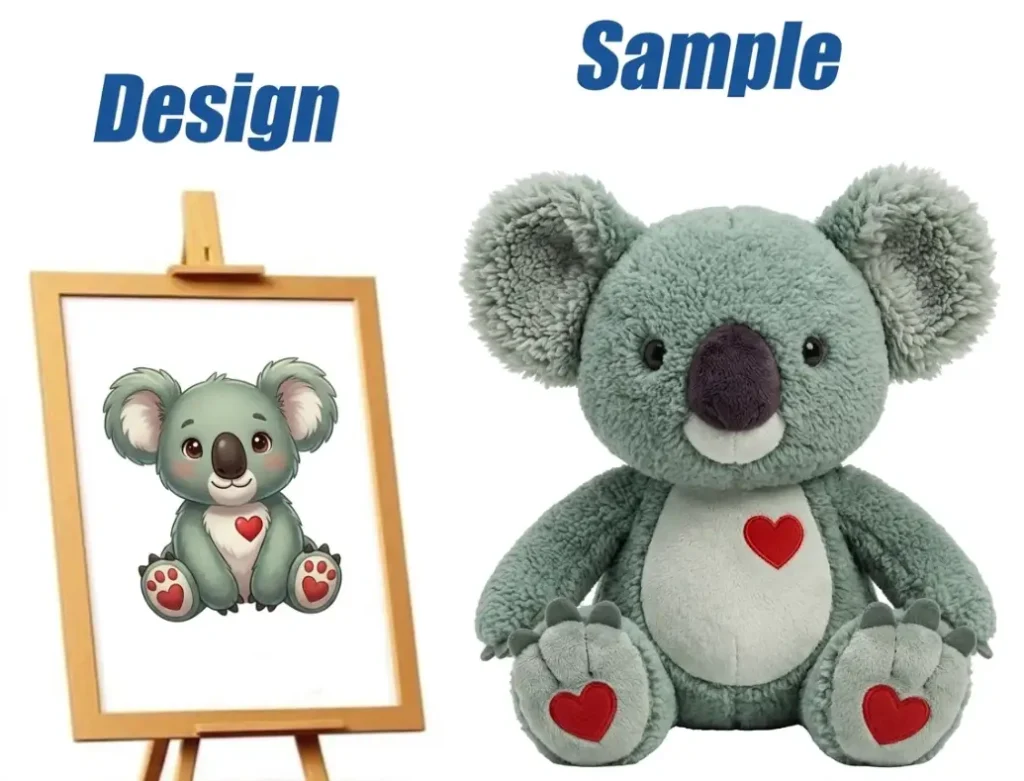
The Brief Quality Investment — How Better Preparation Reduces Sampling Rounds
The most direct way to reduce sampling cost is to invest in brief quality before the first sample is commissioned. A comprehensive design brief — including dimensional specifications with tolerances, fabric and filling specifications with grade references, color references in Pantone or physical swatch, accessory specifications with sizes and attachment positions, and reference images or sketches from multiple angles — gives the factory’s pattern-making and sampling team everything they need to produce a first sample that accurately reflects the buyer’s intent.
The investment required to produce a comprehensive brief is typically two to four hours of additional preparation time. The return on that investment — measured in revision rounds avoided, at $200 to $300 per round including shipping — is consistently positive. Buyers who treat brief preparation as a cost-saving activity rather than an administrative burden consistently achieve fewer revision rounds and lower total sampling expenditure than those who brief loosely and refine through iteration.
Digital Approval Before Physical Sampling — A Revision Round Eliminator
For buyers working with experienced factories that provide digital rendering or 3D visualization capabilities, approving design details digitally before committing to a physical sample can eliminate one or two revision rounds from the sampling process. Digital approval is particularly effective for color confirmation — where Pantone-matched digital renderings can confirm colorway decisions without requiring a physical sample — and for proportion and panel layout review, where basic 3D visualization surfaces the most common early-round revision triggers before any material cost is incurred.
Not all plush toy factories offer this capability, but for buyers who are developing complex character designs with multiple colorways, the sampling cost savings from digital pre-approval justify seeking out factories that do. A single revision round eliminated represents $200 to $350 in direct savings and 7 to 14 days of timeline recovery.
How Do Compliance and Testing Costs Factor Into Total Manufacturing Cost — and How Can They Be Managed More Efficiently?
Compliance and testing costs are fixed project expenses that do not scale with order volume — a product test under ASTM F963 costs approximately the same whether the order is 500 units or 5,000. This means the per-unit impact of compliance costs is highest at low volumes and lowest at high volumes — and that compliance cost management is most commercially significant for buyers ordering at lower quantities who may not fully account for these costs in their total project budget.
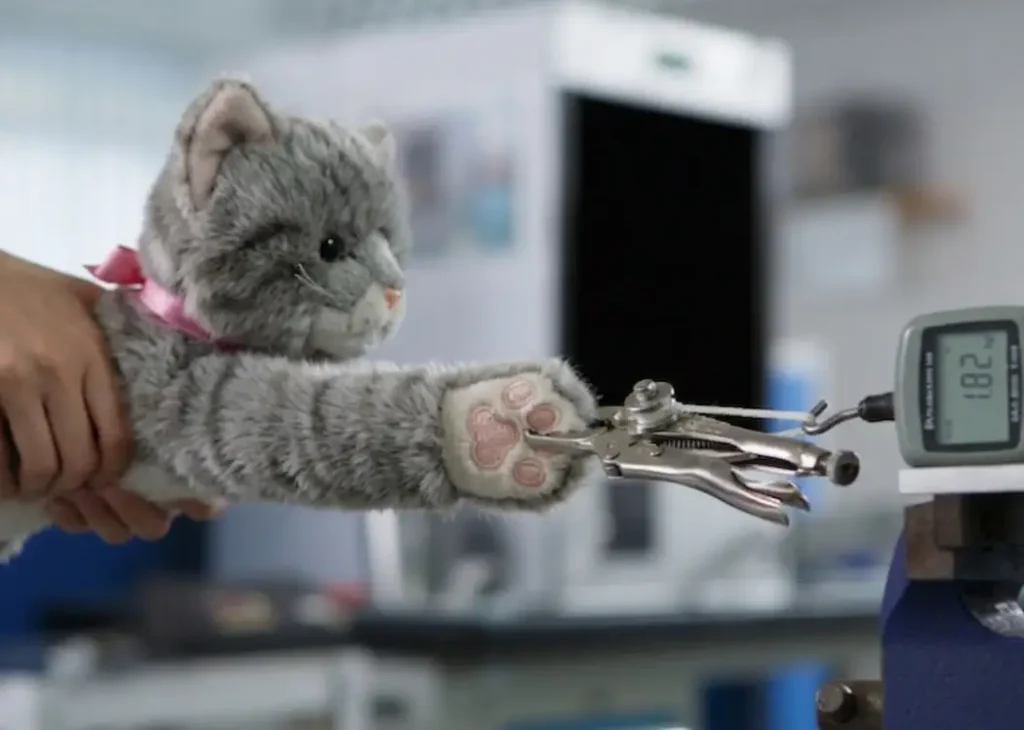
The most common compliance cost management mistake is treating testing as an afterthought — commissioning product testing only after production is complete, and then discovering either that the product passes and testing was straightforward, or that the product fails and the remediation costs are substantial. A prevention-first approach to compliance cost — using certified materials from verified suppliers, validating compliance status at the material sourcing stage, and selecting testing scope appropriate for the target market — consistently produces lower total compliance expenditure than a detection-first approach.
Compliance Cost Scenarios and Per-Unit Impact at Different Order Volumes
| Compliance Scenario | Typical Cost | Per-Unit Cost at 500 Units | Per-Unit Cost at 2,000 Units | Per-Unit Cost at 5,000 Units |
|---|---|---|---|---|
| ASTM F963 test (US market) | $450–$800 | $0.90–$1.60 | $0.23–$0.40 | $0.09–$0.16 |
| EN71 test (EU market) | $500–$900 | $1.00–$1.80 | $0.25–$0.45 | $0.10–$0.18 |
| REACH chemical screening | $300–$600 | $0.60–$1.20 | $0.15–$0.30 | $0.06–$0.12 |
| Compliance failure + retest | $2,000–$8,000+ | $4.00–$16.00 | $1.00–$4.00 | $0.40–$1.60 |
| Material pre-certification (OEKO-TEX fabric) | $0 extra | $0 | $0 | $0 |
Bundling Tests and Using Pre-Certified Materials
Two specific strategies reduce compliance cost without reducing compliance coverage. First, bundling tests: when launching multiple SKUs that share the same base construction and materials, a single compliance test on the most complex variant frequently covers the entire range — because if the most demanding design passes, simpler variants using the same materials and construction are very likely to pass as well. Commissioning individual tests for each SKU when the underlying materials are shared is usually unnecessary and always expensive.
Second, specifying pre-certified materials: fabrics carrying current OEKO-TEX Standard 100 certification, accessories with existing pull test documentation, and fillings with chemical test reports already in place reduce the testing scope required at the product level — because the material-level compliance is already established. Working with a factory that sources certified materials as standard practice reduces the buyer’s compliance testing burden to product-level structural and mechanical testing, rather than requiring both material and product testing from scratch.
Tip — Test the Most Complex SKU First, Then Apply Coverage to the Range
If you are launching a range of plush toys that share the same outer fabric, filling, and accessory components but differ in size or colorway, discuss with your testing laboratory whether a single test on the most complex or largest variant can cover the full range. Many accredited laboratories offer range testing structures where one product serves as the representative test vehicle for a family of products with shared materials and construction. This approach can reduce total compliance testing expenditure by 40 to 65 percent on multi-SKU launches — without reducing the compliance coverage that each product in the range requires for its target market.
How Does Packaging Specification Affect Manufacturing Cost — and Where Is the Optimization Opportunity?
Packaging is one of the most frequently over-specified cost components in custom plush toy production. Buyers who are rightly focused on product quality sometimes apply the same premium specification to packaging that they apply to the product itself — commissioning custom rigid boxes, foil-stamped closures, tissue paper wrapping, and full-bleed print inserts for products that are sold through channels where this packaging format adds no commercial value and most of it is discarded at the point of unboxing.
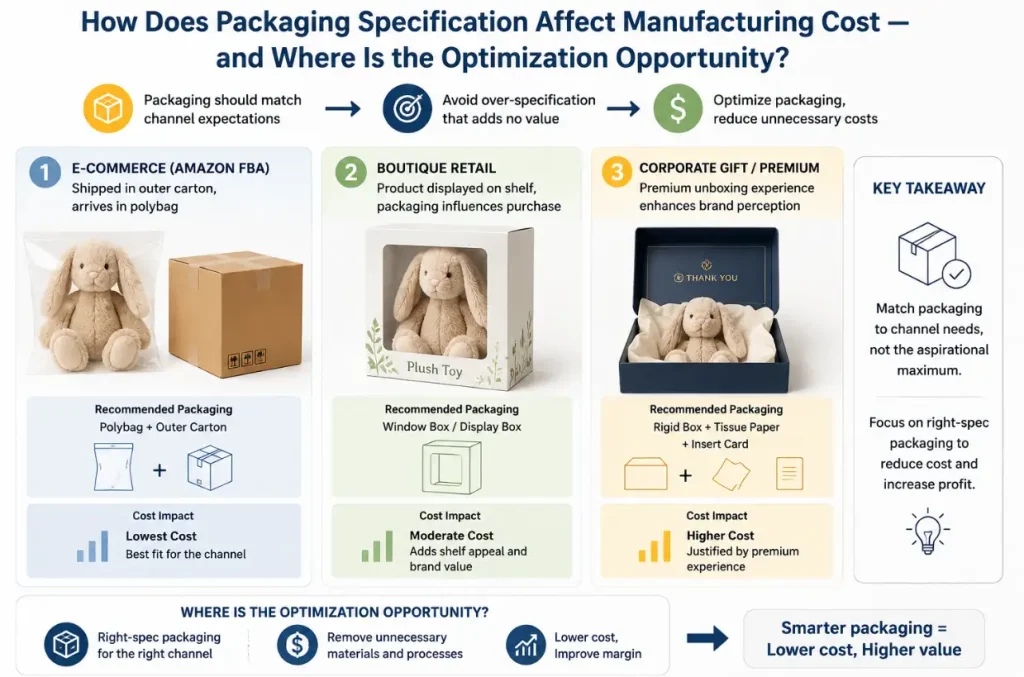
The optimization principle for packaging cost is channel alignment: packaging should be specified to meet the expectations and requirements of the specific sales channel, not the aspirational maximum. An Amazon FBA product that ships in an outer carton and arrives in a polybag does not benefit from a $4 rigid box that most buyers will never see intact. A boutique retailer’s shelf product has different expectations. A corporate gift with a premium unboxing requirement is different again.
Packaging Cost by Format and Channel Suitability
| Packaging Format | Typical Cost per Unit | Best-Fit Sales Channel | Cost vs. Next Level Down |
|---|---|---|---|
| Polybag only | $0.05–$0.15 | Amazon FBA, wholesale inner | — |
| Polybag + printed header card | $0.20–$0.45 | Retail hook display, online DTC | +$0.15–$0.30 vs. polybag |
| Folding box (kraft or printed) | $0.45–$1.20 | DTC, boutique retail | +$0.25–$0.75 vs. header card |
| Custom window box | $1.20–$2.40 | Specialty retail, gifting | +$0.75–$1.20 vs. folding box |
| Custom rigid box (set-up) | $2.50–$5.50 | Premium gift, IP licensing | +$1.30–$3.10 vs. window box |
| Full gift set (box + tissue + insert card) | $4.00–$8.00 | Corporate gift, premium DTC | +$1.50–$2.50 vs. rigid box |
The Packaging Dieline Reuse Strategy
For buyers managing multiple SKUs, packaging cost can be reduced significantly by designing packaging dielines that accommodate multiple products — a single box structure with variable insert cards or sleeve printing that works across an entire product range. Rather than commissioning a unique packaging dieline for each SKU, a master dieline with print variable zones reduces both the tooling cost for packaging production and the design and artwork cost for each new product addition. This approach is particularly effective for product families launched in waves, where a consistent packaging architecture across the range adds visual cohesion while reducing per-SKU packaging development cost.
How Does Supplier Relationship Structure Affect Long-Term Manufacturing Cost — and What Practices Reduce Cost Over Multiple Orders?
The unit price on a single production order is only one dimension of manufacturing cost. For buyers who source plush toys across multiple orders and multiple production runs, the structure of the supplier relationship — the communication quality, the payment terms, the development support, the shared learning that accumulates over time — has a compounding effect on total manufacturing cost that can dwarf the unit price differences between suppliers.
Long-term supplier relationships reduce manufacturing cost through several specific mechanisms: accumulated pattern libraries that eliminate resampling costs when products are reordered; established quality standards that reduce first-run defect rates and rework costs; preferred payment terms that improve cash flow economics; and preferential capacity access during peak production periods that reduces the risk of expedited shipping costs from timeline compression. These are real cost reductions — not soft relationship benefits — and they accrue specifically to buyers who treat supplier relationships as long-term investments rather than transactional engagements.
Long-Term Supplier Relationship Cost Benefits
| Relationship Stage | Cost Benefit Available | Typical Value per Order | How It Accumulates |
|---|---|---|---|
| Order 1 (new relationship) | Baseline pricing, standard terms | — | Benchmark established |
| Order 2–3 (established) | Reorder pricing, existing patterns | $200–$600 sampling saved | Pattern library starts forming |
| Order 4–6 (preferred) | Improved payment terms, volume pricing | $300–$900 per order | Trust enables flexible terms |
| Order 7+ (strategic) | Capacity reservation, co-development | $500–$2,000+ per order | Supplier invests in buyer success |
Reorder Cost Economics — The Hidden Advantage of Supplier Continuity
The most concrete cost advantage of long-term supplier relationships is reorder economics. When a product is reordered from the factory that produced the original run, the pattern library, material specifications, approved counter sample, and production standard all already exist. The sampling cost for a straight reorder — same design, same materials, minor quantity adjustment — is typically zero or minimal. The revision round count for a reorder from an established supplier is typically zero. The quality risk for a reorder is lower because the factory’s QC team already knows the product’s quality profile and the specific checkpoints that matter.
Buyers who switch suppliers between reorders — either opportunistically chasing a lower quoted price or in response to a service issue — lose all of these accumulated benefits and return to a first-order cost structure: full sampling fees, standard pricing, standard terms, and the quality risk of an unfamiliar production team working with a design they have never produced. The total cost of supplier switching is almost always higher than the unit price difference that motivated the switch.
Tip — Negotiate Payment Terms as a Cost Lever, Not Just a Cash Flow Preference
Payment terms directly affect the effective cost of a production run by determining how long the buyer’s capital is committed before the goods are received and saleable. A factory requiring 50% deposit at order and 50% balance before shipment commits the buyer’s capital for the entire production period — typically 45 to 75 days. A factory offering 30% deposit with 30-day net payment terms on the balance reduces the capital commitment period significantly. Over the course of a year with multiple production runs, the difference in working capital efficiency between these two payment structures has real commercial value that should be explicitly considered when comparing supplier offers. Established suppliers who have confidence in the buyer relationship are frequently willing to offer more favorable payment terms — making this a cost reduction that is specifically available to buyers who invest in long-term relationships.
What Is the Total Cost Reduction Potential — and How Do These Levers Work Together?
Each of the cost reduction levers described in this guide operates independently — a buyer can capture value from design simplification without optimizing packaging, or from supplier relationship depth without consolidating volumes. But the levers are most powerful in combination, because they address different components of the total cost structure simultaneously.
Combined Cost Reduction Scenario (1,000-Unit Order, Baseline vs. Optimized)
| Cost Component | Baseline Scenario | Optimized Scenario | Saving |
|---|---|---|---|
| Unit price (fabric + labor + overhead) | $6.20 × 1,000 | $5.10 × 1,000 | $1,100 |
| Sampling cost (3 rounds vs. 1 round) | $720 | $240 | $480 |
| Packaging (custom rigid box vs. folding box) | $3,200 | $800 | $2,400 |
| Compliance testing (individual vs. bundled) | $1,400 | $600 | $800 |
| Payment terms cost (50/50 vs. 30/net30) | ~$300 | ~$80 | $220 |
| Quality rework (8% defect rate vs. 2%) | $480 | $120 | $360 |
| Total project cost | $12,300 | $6,950 | $5,350 (43% reduction) |
The scenario above is illustrative rather than universal — the specific savings available depend on the buyer’s starting position, product type, and current supplier relationship. But the structural point it demonstrates is consistent: the largest cost reduction opportunity in plush toy manufacturing is not found in the unit price negotiation. It is found in the combination of design optimization, material specification efficiency, volume consolidation, sampling process improvement, packaging rationalization, and compliance cost management that together determine the true total cost of bringing a plush toy product to market.

Frequently Asked Questions
Q1: Is it possible to reduce plush toy manufacturing costs without reducing product quality, or are the two always in tension?
They are not inherently in tension when cost reduction targets over-specification rather than specification reduction. Many custom plush orders include design elements, material specifications, and packaging formats that cost more than the product’s market position requires — not because they were deliberately chosen for quality reasons, but because they were the default option, the first specification provided, or a legacy choice carried forward from an earlier product version without review. Identifying these elements — a fabric GSM higher than the product’s target softness requires, a panel construction more complex than the design’s character demands, a packaging format more premium than the sales channel justifies — and optimizing them to correct specification rather than maximum specification consistently reduces cost without reducing the quality characteristics that actually matter to end customers.
The distinction that prevents quality compromise is between right-sizing and downgrading. Right-sizing means specifying exactly what the product needs to meet its quality target. Downgrading means specifying less than the product needs and accepting a quality reduction. Every cost reduction recommendation in this guide targets over-specification — the gap between what a product has and what it needs — rather than specification reduction below the appropriate quality floor.
Q2: How should buyers handle the situation where a lower-priced supplier offers a significantly lower unit price but requires a higher MOQ than the buyer can currently commit to?
This is a very common situation, and the correct analytical response is to compare suppliers at the buyer’s actual target volume rather than at each supplier’s MOQ. A supplier with a lower unit price at a 5,000-unit MOQ is not offering a better deal to a buyer whose planned order is 1,000 units — it is offering a deal that requires the buyer to commit five times their intended volume to access the lower price. The total capital commitment, inventory risk, and cash flow impact of the higher MOQ order almost always exceed the unit price saving, particularly for buyers who are still validating market demand for the product.
The productive question is whether the volume required to access better pricing can be reached organically — through demand growth, SKU consolidation, or phased order planning — within a timeline that makes the commitment sensible. If it can, the higher-MOQ supplier may become the better long-term option. If it cannot, the correct comparison is at the buyer’s actual volume, where the higher-MOQ supplier’s pricing advantage may not exist or may be marginal relative to the risk of over-committing.
Q3: What is the most effective way to approach cost reduction conversations with an existing supplier without damaging the relationship?
The most effective approach is to frame the cost reduction conversation as a collaborative exercise rather than a price negotiation. Rather than presenting a lower competitor price and asking the supplier to match it, present the specific cost elements you would like to optimize — design simplification options, material specification alternatives, volume consolidation opportunities, packaging format changes — and ask the supplier’s input on where the most meaningful savings can be captured without compromising quality.
This approach works for several reasons. It treats the supplier as a problem-solving partner rather than an adversary, which maintains the relationship dynamic that produces long-term cost benefits. It focuses the conversation on structural cost factors — design, specification, volume — rather than margin, which suppliers can address without eroding the commercial foundation of the relationship. And it frequently surfaces cost reduction opportunities that the buyer was not aware of, because experienced factories often have specific insight into which design elements are disproportionately expensive to produce and which alternatives would achieve the same result at lower cost.
Q4: How much of a cost difference between two supplier quotes should a buyer expect before switching suppliers, accounting for the hidden costs of switching?
The hidden costs of supplier switching are consistently underestimated in the moment and consistently recognized in retrospect. When switching from an established supplier to a new one, the buyer incurs full first-order costs: complete sampling expense, standard pricing without relationship adjustments, standard payment terms, the quality risk of a factory that has never produced the specific design, and the management time required to establish communication protocols and quality standards from scratch.
A practical framework is to require that a competing supplier’s total project cost — incorporating full sampling cost, compliance cost, packaging cost, and estimated quality management cost for a first order — be at least 15 to 20 percent lower than the established supplier’s comparable total cost before the switch is worth considering. Unit price comparisons that show a 5 to 8 percent advantage for a new supplier almost never produce net savings when all switching costs are accounted for. The threshold rises further for buyers with complex designs, tight quality standards, or compliance-sensitive target markets, where the risk and cost of onboarding a new supplier are highest.
Q5: Are there specific plush toy product types where cost reduction opportunities are significantly higher than in others?
Yes — the cost reduction opportunity is highest in product types that have drifted furthest from right-specification over time, which tends to occur in established product lines that have accumulated complexity with each iteration. Products that were originally designed without a cost-conscious brief — where specifications were set without explicit cost rationale — frequently carry over-specification in multiple components simultaneously: too many panels, higher fabric GSM than required, custom accessory sizes when stock sizes would work, complex packaging for a channel that doesn’t require it. These products offer the highest aggregate cost reduction opportunity because each component can be right-sized independently.
Conversely, the cost reduction opportunity is lowest in truly premium or IP-licensed products where the design specifications are determined by brand standards, licensing agreements, or explicit premium positioning that makes simplification commercially counterproductive. For these products, the appropriate cost management strategy is compliance cost efficiency, volume consolidation, and payment term optimization rather than specification reduction — because the specification itself is not overstated relative to the product’s market position.
Q6: How should buyers think about investing in better tooling or custom accessories when the upfront cost is high but the per-unit cost may be lower at scale?
Tooling investment decisions should be evaluated on a break-even analysis that compares the upfront tooling cost against the per-unit saving over the expected production lifetime of the product. A custom safety eye mold that costs $400 and saves $0.15 per unit compared to the non-stock alternative breaks even at approximately 2,700 units — making it financially justified for any product expected to run beyond that volume, and financially unjustified for products likely to be discontinued or redesigned before reaching it.
The key variables in this analysis are: the upfront tooling cost, the per-unit saving versus the stock alternative, the expected total production volume over the product’s lifetime, and the tooling’s residual value if the product is discontinued (usually zero for highly specific tooling, potentially positive for reusable molds). Products with large, predictable order volumes over multiple seasons are the best candidates for tooling investment. Products with uncertain demand, frequent design iteration, or short expected commercial lifetimes are better served by stock component alternatives that carry no upfront commitment.
Conclusion
Reducing plush toy manufacturing costs is a multi-lever exercise, not a single negotiation. The buyers who achieve the most durable and significant cost reductions are those who approach manufacturing cost as a system — understanding which components are largest, which are most controllable, and which levers produce the most cost reduction per unit of effort — rather than those who focus narrowly on the unit price conversation.
Design simplification, material right-specification, volume consolidation, sampling process efficiency, compliance cost management, packaging rationalization, and long-term supplier relationship investment are each independently valuable and collectively powerful. Applied together with a clear understanding of the specific cost structure of the product being sourced, they consistently produce total cost reductions of 25 to 45 percent compared to the starting position — while maintaining or improving the quality characteristics that determine commercial success in the markets where the products are sold.
The framework in this guide provides the analytical structure for building that approach. The specific actions required to implement it — reviewing design specifications with a cost lens, requesting material alternatives, consolidating volumes, investing in brief quality, bundling compliance tests, and deepening supplier relationships — are all available to any buyer willing to treat cost optimization as a discipline rather than a transactional event.